Immigration Is Not a Snapshot—It’s a Timeline
They arrive in North America carrying stories more than luggage.
Some carry degrees that are not immediately recognized. Others carry skills that don’t translate neatly on paper. And many carry something harder to measure—hope that the journey ahead will justify everything left behind.
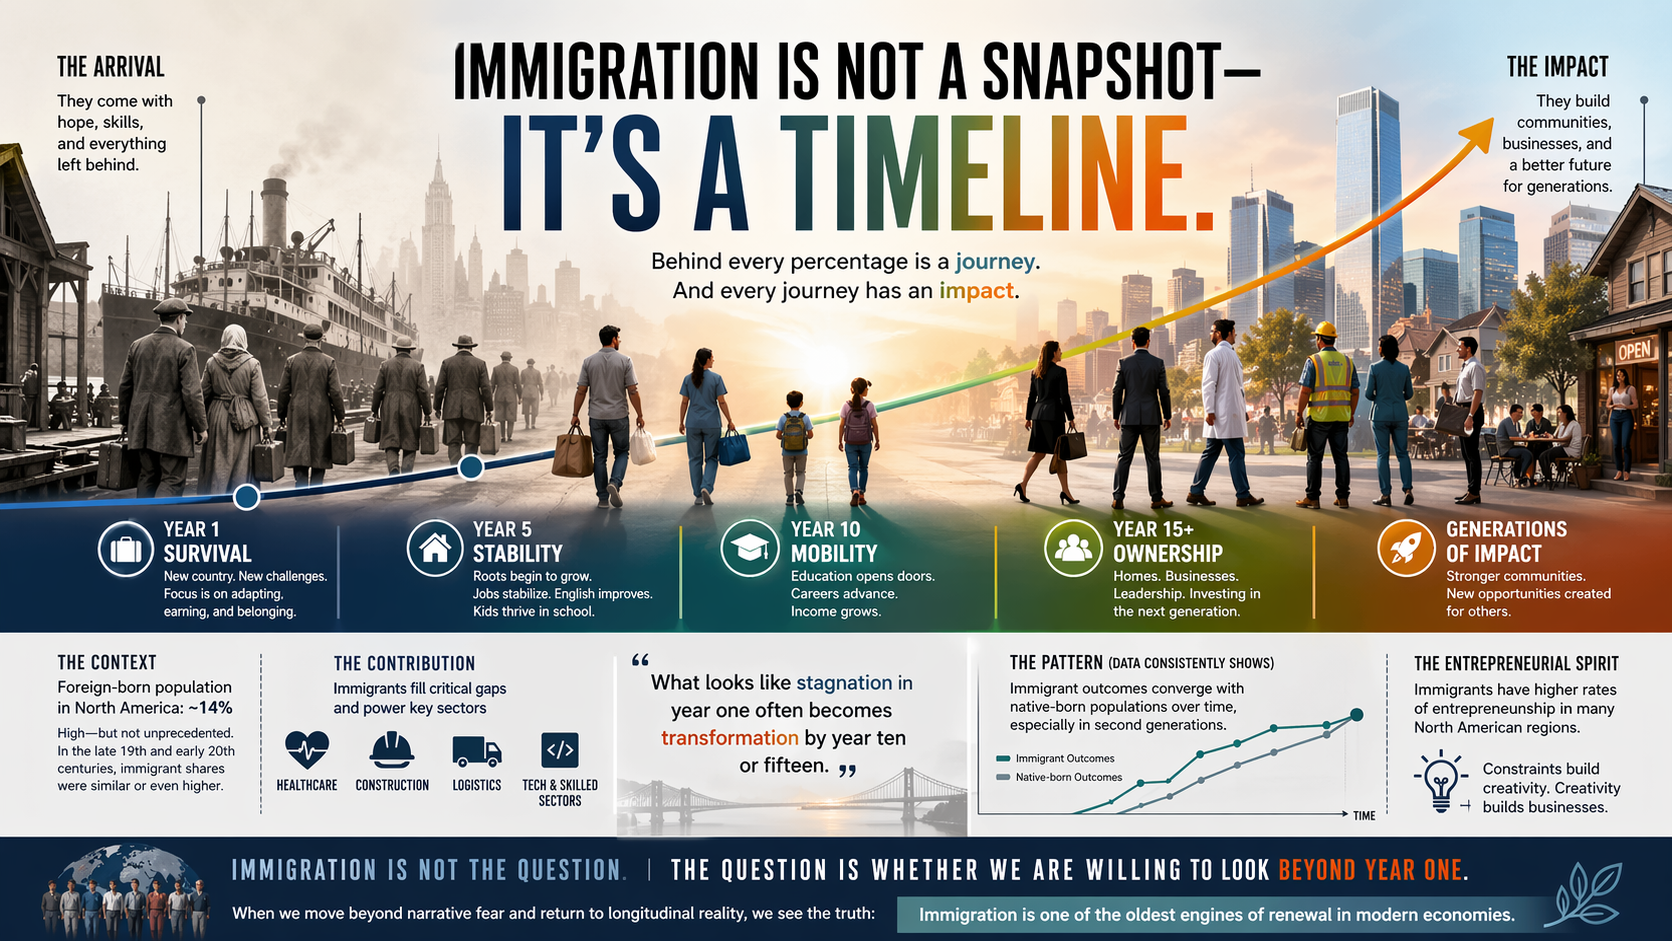
At first glance, they are often described in numbers. Foreign-born population: about 14%. A statistic that is frequently used in debates, sometimes as a warning, sometimes as a concern, and sometimes without context.
But numbers, on their own, rarely tell the full story.
Because history adds nuance that headlines often forget.
The truth is, a foreign-born population of around 14% is high—but not unprecedented in North American history. At various points in the late 19th and early 20th centuries, the United States saw immigrant shares that were equal or even higher than today. Waves from Europe once reshaped cities, labor markets, and entire industries. What seemed “unusual” at the time eventually became the foundation of modern economic growth and cultural identity.
So the question is not whether immigration is “new.”
It is whether we are reading the story correctly.
Behind every percentage is a trajectory. And that trajectory is where the real economics lives.
A father from East Africa starts in a warehouse job. A mother takes long shifts in caregiving. The children enter schools where they must learn faster than the system expects them to adapt. At first, the narrative is survival. Rent. Bills. Language barriers. Exhaustion.
But data tells us something important: immigrant upward mobility, over time, tends to converge with native-born populations, especially in second generations. Education becomes the turning point. Children outperform their starting conditions. Universities become accessible. Skilled employment follows.
What looks like stagnation in year one often becomes transformation by year ten or fifteen.
And this is where narrative often diverges from reality.
Because the visible story is the early struggle. The invisible story is the compounding effect of time.
Labor market data consistently shows immigrants filling critical gaps—healthcare support roles, construction labor, logistics, and increasingly, skilled tech and entrepreneurial sectors. They do not simply “take jobs”; they expand capacity in systems that would otherwise contract under demographic pressure. In aging economies especially, this contribution is not marginal—it is structural.
At the same time, immigrant entrepreneurship rates are often higher than native-born averages in many North American regions. That does not happen randomly. It happens because constraints early in life often build adaptability later in life.
But perhaps the most misunderstood part is perception versus progression.
In year one, the story is limitation.
In year five, it is stability.
In year ten, it is mobility.
In year fifteen, it is often ownership—of homes, of careers, of businesses, and sometimes of opportunities for others.
This is not romanticization. It is pattern recognition.
And yet, public conversation often freezes immigrants at their starting point, rather than following them through their trajectory. That is where the disconnect forms—not in the data itself, but in how long we are willing to look at it.
The real nuance is this:
Immigration is not a snapshot. It is a timeline.
And when you extend that timeline far enough, the story changes shape entirely.
What begins as arrival becomes integration. What begins as survival becomes contribution. What begins as a statistic becomes a generation that is no longer defined by where it came from, but by what it built.
And perhaps the most important takeaway is simple:
When we move beyond narrative fear and return to longitudinal reality, we stop asking whether immigration is a disruption—and start recognizing it as one of the oldest engines of renewal in modern economies.